Selected work across mobility, public transit and spatial computing
My design experience spans location-aware experiences, transit information systems, and production-level geospatial visualization, exploring how people navigate, interpret, and interact with spatial information.
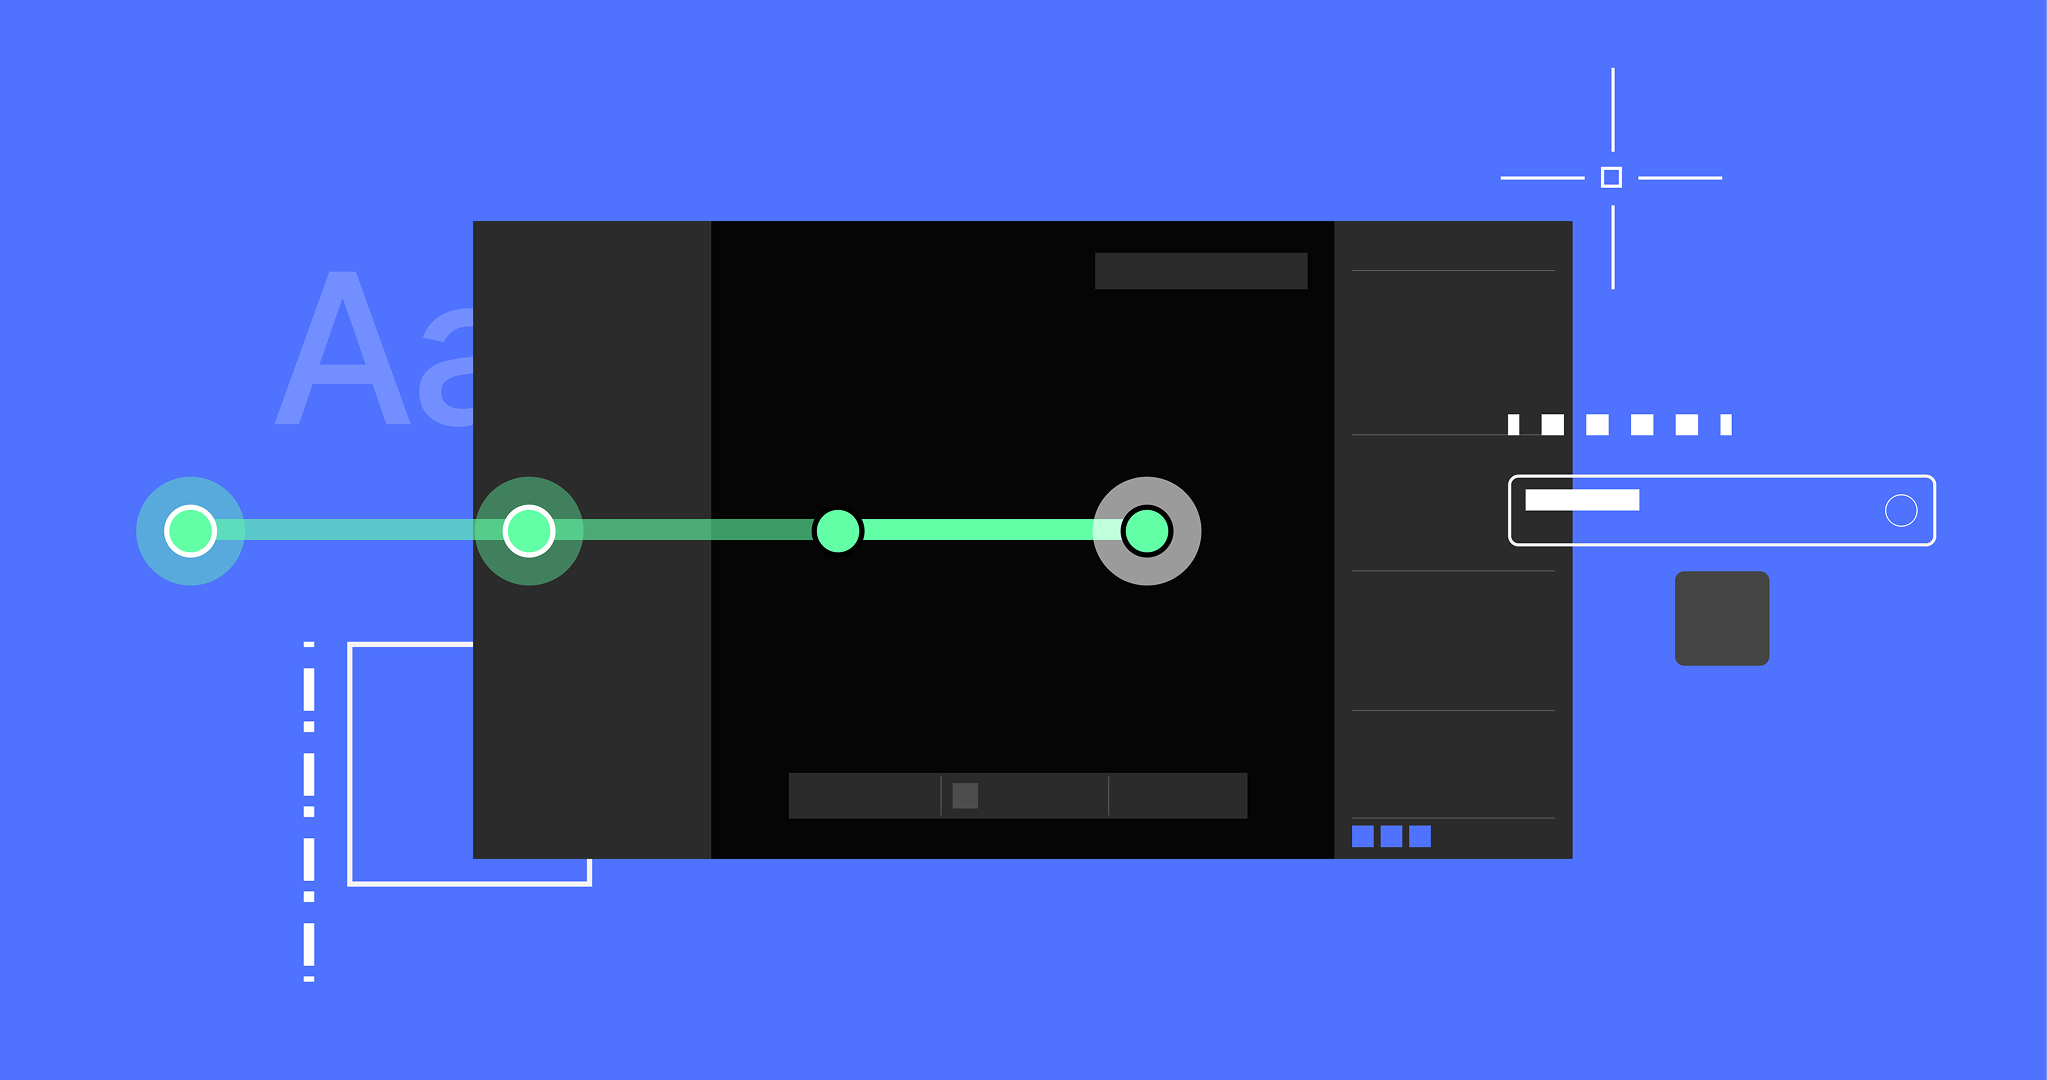
Designed a production-level visual system for working with vector geometry over dense LiDAR point clouds, with graphic rules for lines, vertices and focus states that stay legible across zoom levels and data backgrounds.
COMPANY
Mach9
ROLE
Sole product designer
WHAT I DID
Research, the graphic system for lines and vertices, coded prototypes on real LiDAR data, production specs with engineering
TIMELINE
Dec 2025, 2 weeks
PLATFORM
Digital Surveyor, web CAD editor
Zoom levels
01Zoomed in, vertices sit at full size, with room to pick one.
02Zoom out and they shrink with the view. Across a whole intersection they’re small dots, so hundreds of them don’t bury the lines.
03Select a line and its vertices jump back to full size, on that line only, so it lifts out of everything around it.
04Pick a single vertex from there, without zooming back in. It takes the same yellow ring as up close.
Background styles
01Switch colorization and the lines stay as they are. Only the cloud behind them changes.
02Inferno puts a pink layer on a pink cloud. Hover adds a grey outline; selecting adds a yellow one around a dark keyline.
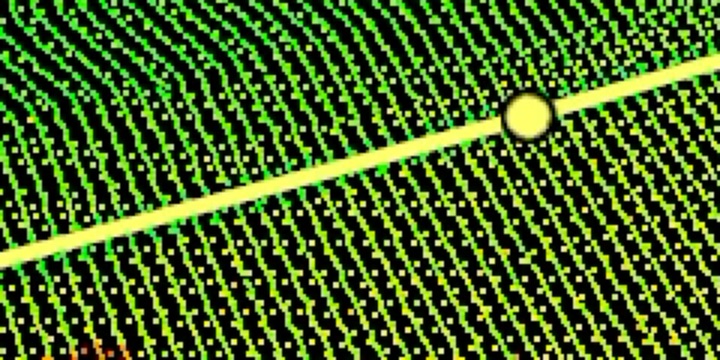
03Leica puts a yellow layer on a yellow cloud, and the selection outline is yellow too.
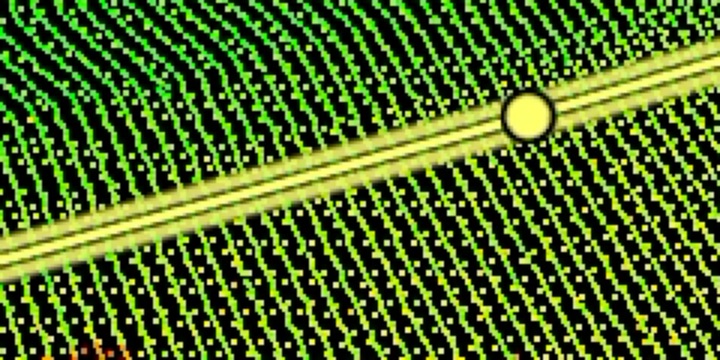
04A thin black keyline between them keeps the original stroke visible. The clip zooms in to show it.
YELLOW ON YELLOW
Default
The layer’s yellow, on a yellow cloud.
Hover
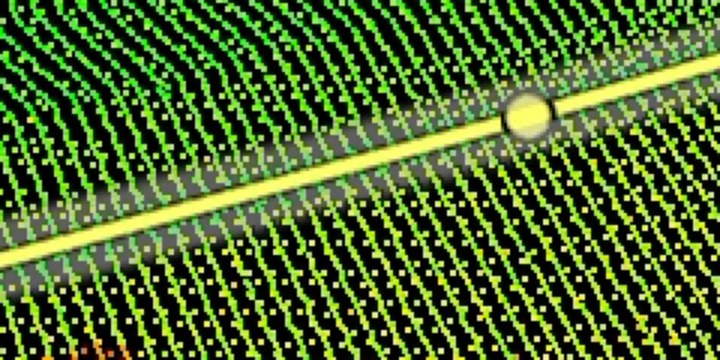
The same grey outline, whatever the line’s color.
BLACK KEYLINE
Line states
3px in the layer’s color and line type, with 7px vertices filled to match.
Final line = layer. What’s on screen is what exports, so users can trust it without a legend.
The line being drawn, in its own style, with a white dotted hairline on top and the point picker under the cursor.
Users confirm they’re drawing the right line before they commit. The hairline, not a new style, says it isn’t finished.
A soft 13px light-grey band at 54% opacity, laid over the line’s vertices, with a thin dark keyline under the line. Its color and type don’t change.
It reads as “clickable” on any point cloud without looking like a new line type.
An 8.5px yellow band around a dark keyline. The vertices keep their color, with a black edge.
One bright selection color that holds up in intensity views, and the user’s color stays untouched.
The vertex rides the point picker with move arrows; the old shape stays as a 30% ghost, with a dashed line from where the vertex started.
Users see what they changed and how far before they let go.
The layer’s line type at 50% opacity, with glowing vertices in the layer’s color, until Tab accepts it.
Users see exactly what they’ll get. Transparency, not a new style, marks it as not theirs yet.
Live specimen
Tradeoffs
Two places where the obvious visual broke, and what the system does instead.
DRAWING
A dashed preview on a dash-space layer
AVOIDDO
A surveyor drawing a dash-space line couldn't tell it from the preview, which looked just like their dashed layer. The preview now matches the line being drawn. Rhino and Plasticity don't add a preview style to polylines either.
DISPLAY
A preview color that vanishes
AVOIDDO
Colorization and intensity change constantly, and a fixed preview color that works on one cloud disappears on the next. No single color works in every case, so the preview keeps the layer color and the UI colors are configurable.
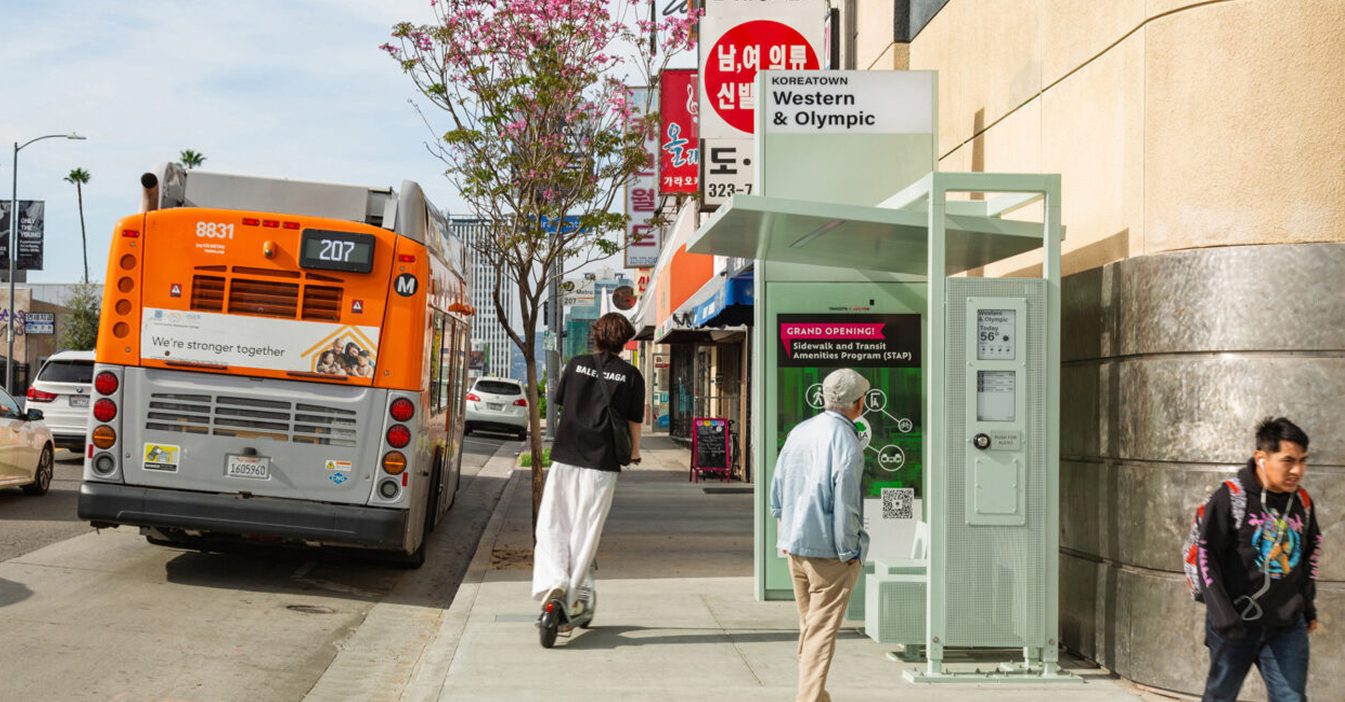
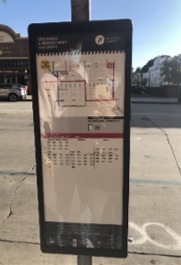
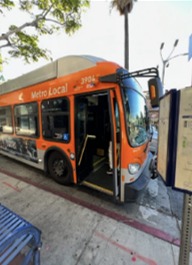
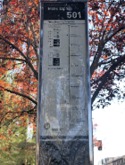
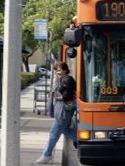
Investigated transit signage and wayfinding through field research and rider interviews, then translated the findings into a unified, accessible display for LA’s bus shelters.
CLIENT
City of Los Angeles
COMPANY
BMW Group Designworks
ROLE
Product & user research, interaction design
WHAT I DID
Field research, rider interviews, the journey map, every illustration, display design and legibility testing
TIMELINE
Nov 2022 – Jun 2023
PLATFORM
E-ink shelter displays
Rider journey
Every step of a bus trip, with the tasks a rider has to complete and the touch points available to help.
Plan the journey
Identify available routes
Determine related transit
Is taking bus a viable option?
Determining sufficient funds
Locate bus stop
Determine which side of the street heads in the right direction.
Identify route
Read the route map.
Identify desired bus
Next bus arrival time/cadence
Identify bus
Track estimated arrival time
Match correct line to approaching bus
Board & pay
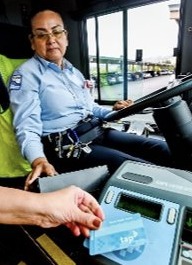
Confirm there is enough balance on Tap card for bus fare.
Pay fare in cash
Tap app
Identify correct stop
Track bus in route to determine number of stops to destination
Identify destination stop
Communicate to driver through button to stop
Connect to another line
Identify correct transfer (line) stops
Determine estimated transfer arrival time
Arrive at destination
Physical Touch Points
Shelter
Stop sign, route map
Stop sign, shelter display
Bus, farebox
Onboard display, stop button
Stop sign, shelter display
Digital Touch Points
Transit app, trip planner
Maps app
Transit app
Real-time arrivals
TAP app
Live bus tracking
Transit app
Design opportunities
Identifying the needs, pain points and available touch points throughout the journey lets us define the solutions, features and experiences that can improve the ride. We take the following approach to identifying relevant opportunities:
Identify the step in the journey
Consider rider needs & pain points
Incorporate rider context & goals
Identify solutions & opportunities
On-site research
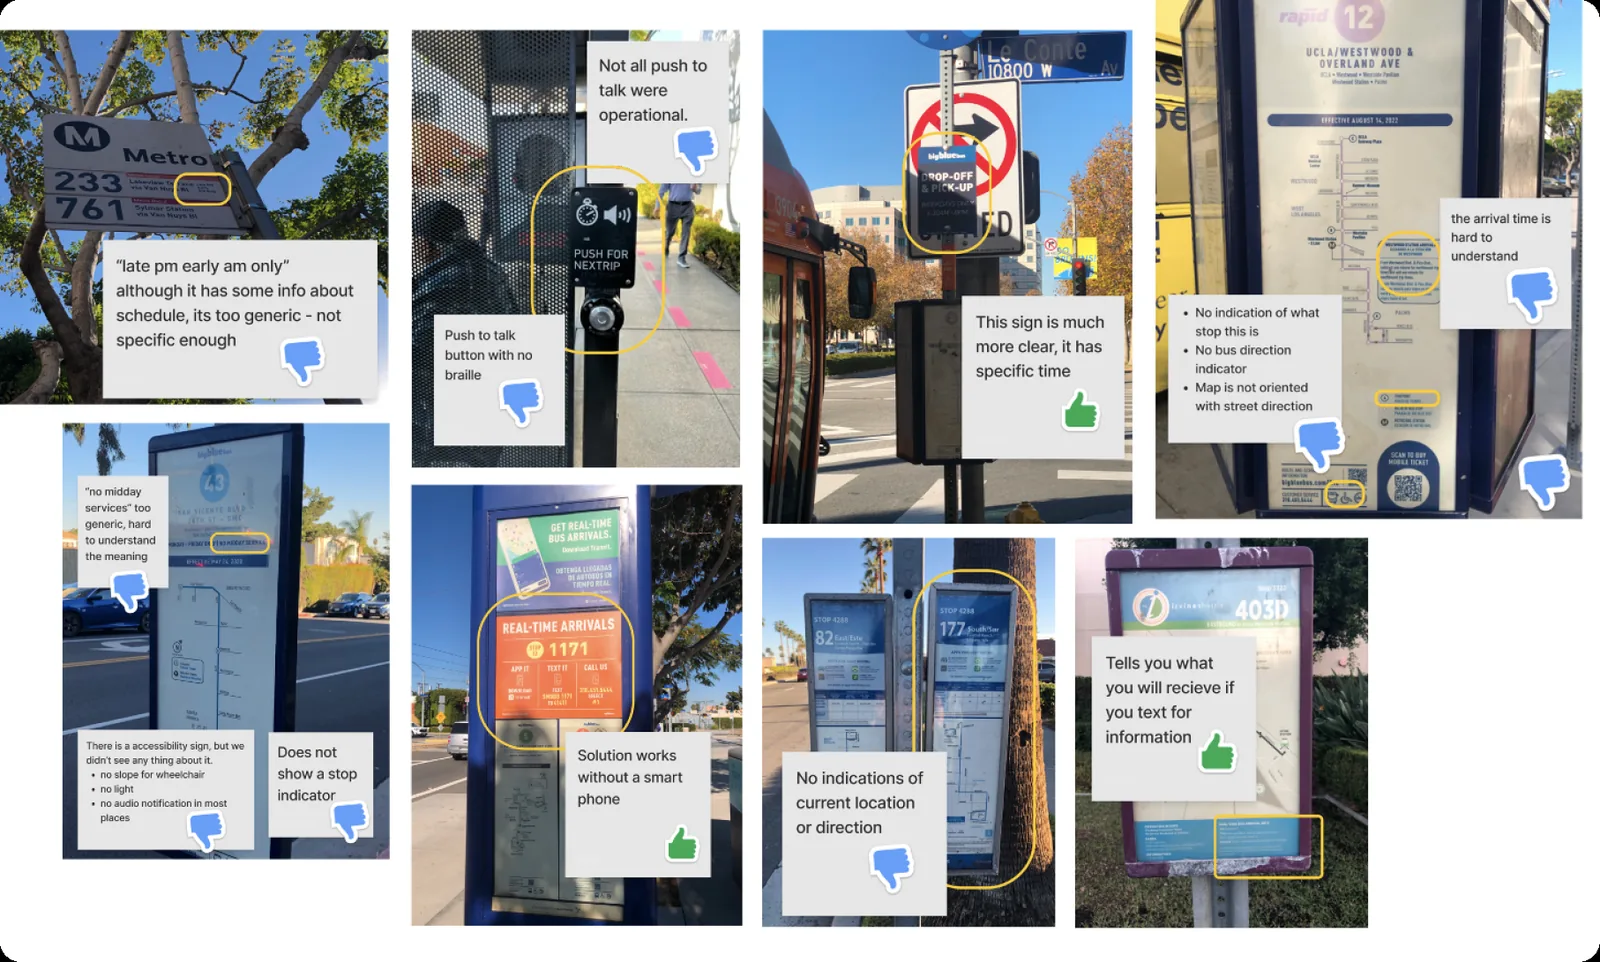
The journey map was built from what riders told us and what the stops themselves showed.
FIELD IMMERSION
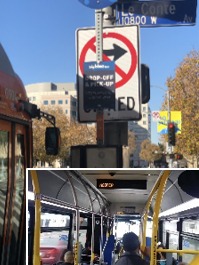
Rode LA buses, photographed stops along the way and evaluated their signage
USER INTERVIEWS
30+ riders: commuters, tourists, event attendees, riders with disabilities and multilingual riders
DESK RESEARCH
Benchmarked transit signage from cities around the world
Usability testing
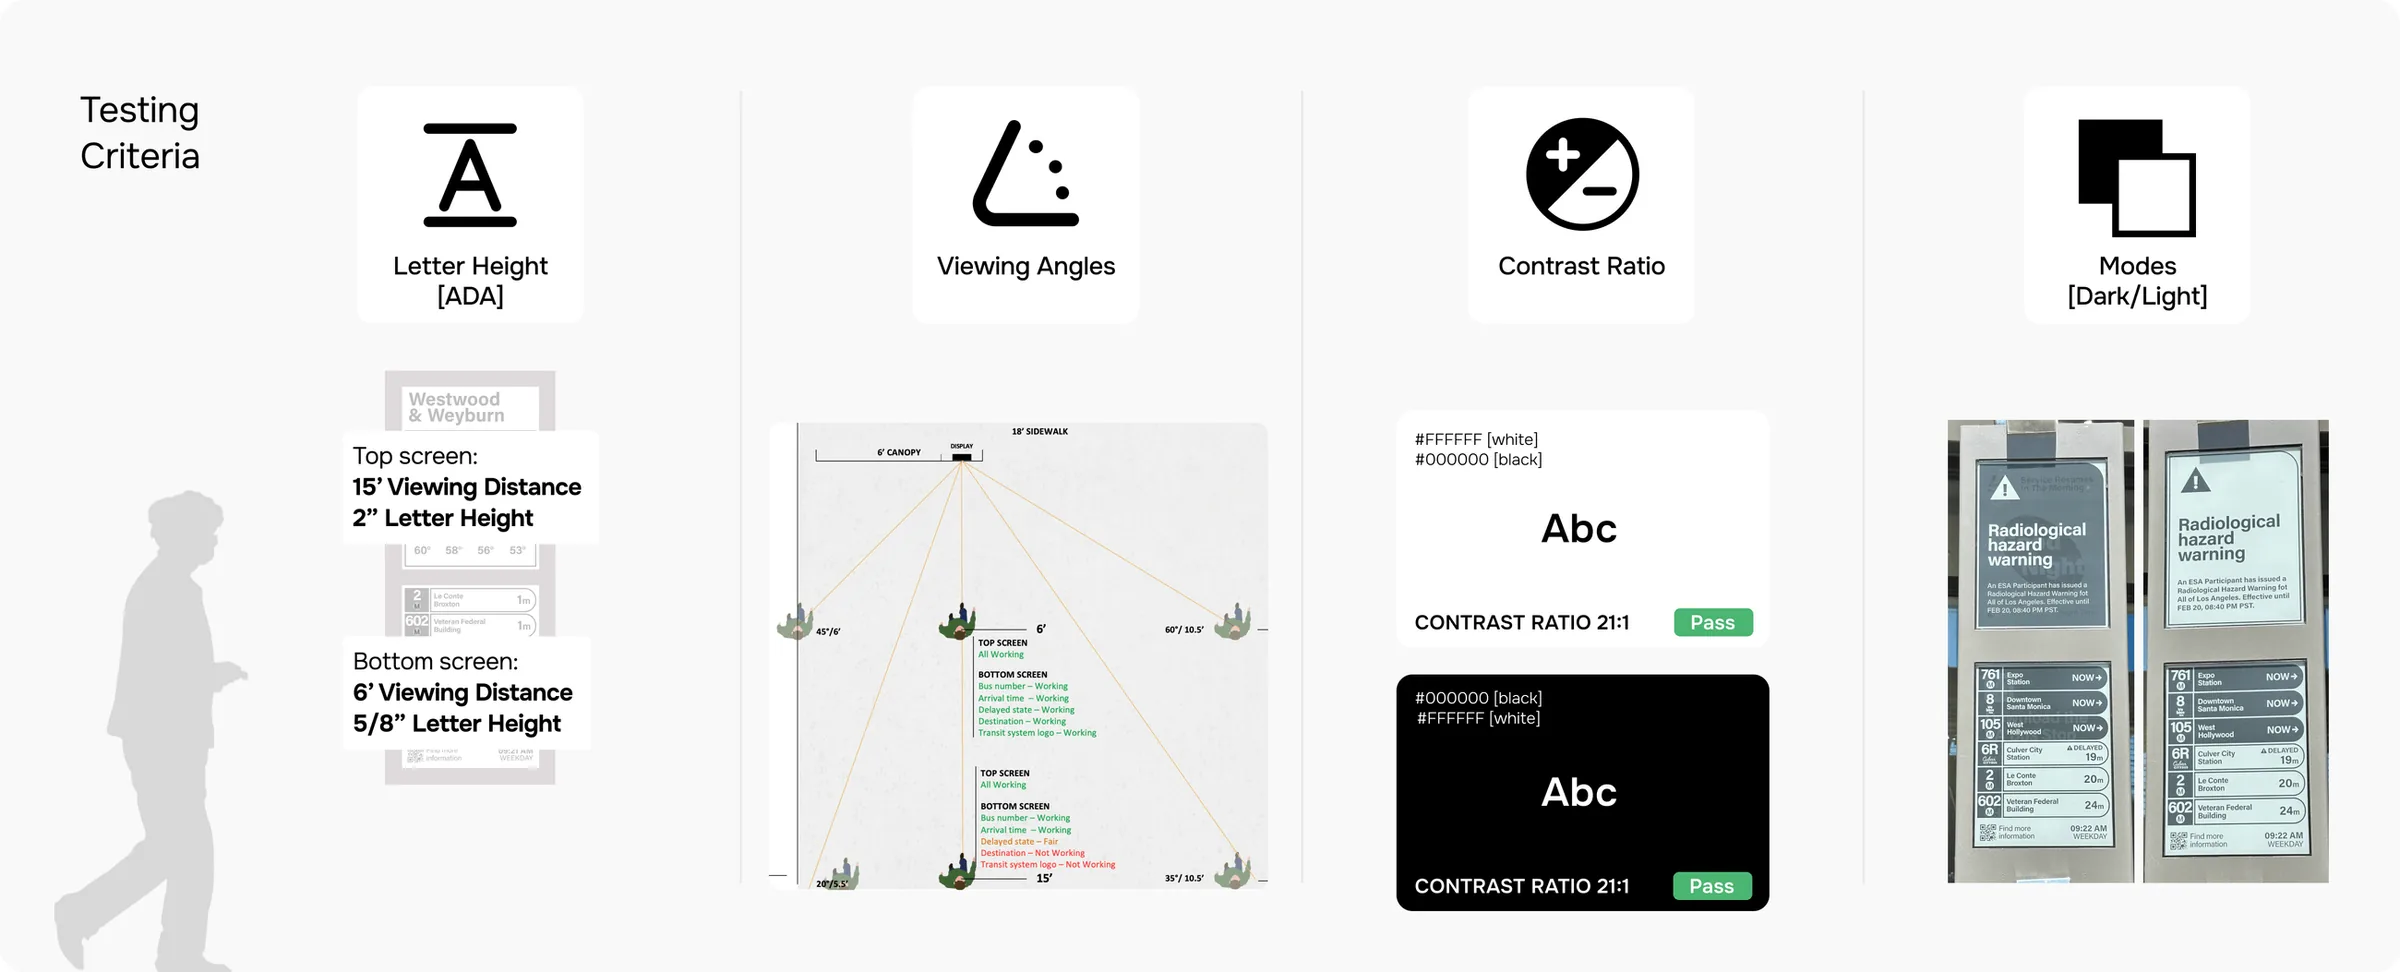
Type size, contrast and layout were tested on the real e-ink hardware, at the distances and angles riders see it from.
LETTER HEIGHT (ADA)
Top screen read from 15 ft with 2 in letters; bottom screen from 6 ft with 5/8 in letters
VIEWING ANGLES
Checked what stays readable from points across the 18 ft sidewalk
CONTRAST RATIO
Black on white and white on black, both 21:1
Outcome
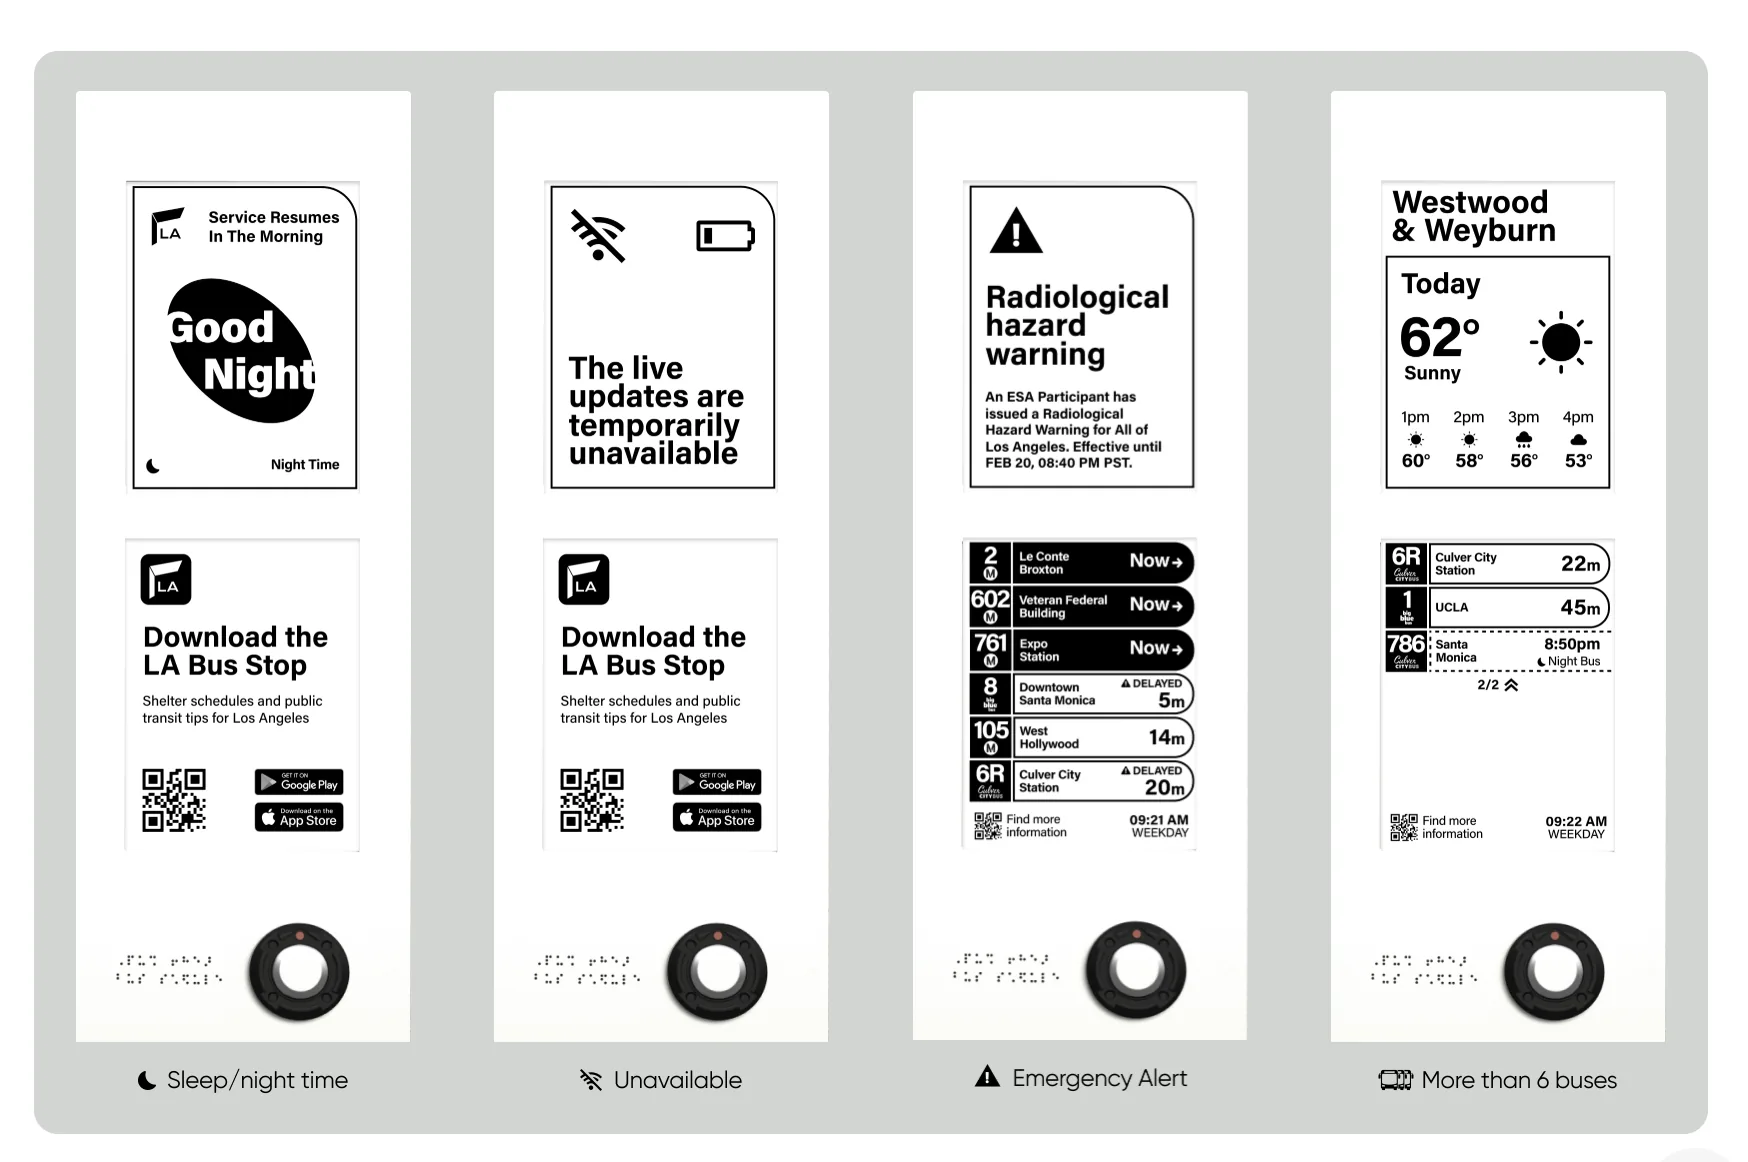
The findings shipped as real-time e-ink displays in LA’s new bus shelters.
Explored map-based mobility concepts, route visualization and interfaces that respond to the user’s proximity to their vehicle, across mobile and in-car experiences.
COMPANY
BMW Group Designworks
ROLE
Visual & interaction design
WHAT I DID
Weekly concept screens, map and route visuals, both app systems, Apple Watch
TIMELINE
Jun – Oct 2022
PLATFORM
iOS, Apple Watch, in-car display
Mobility map
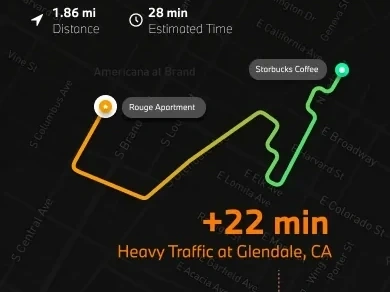
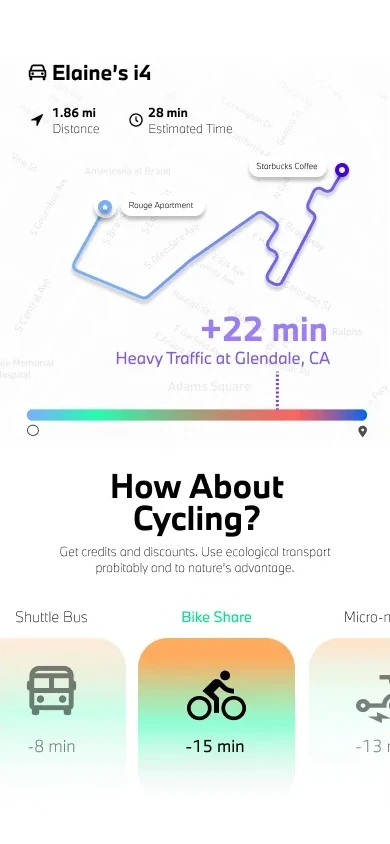
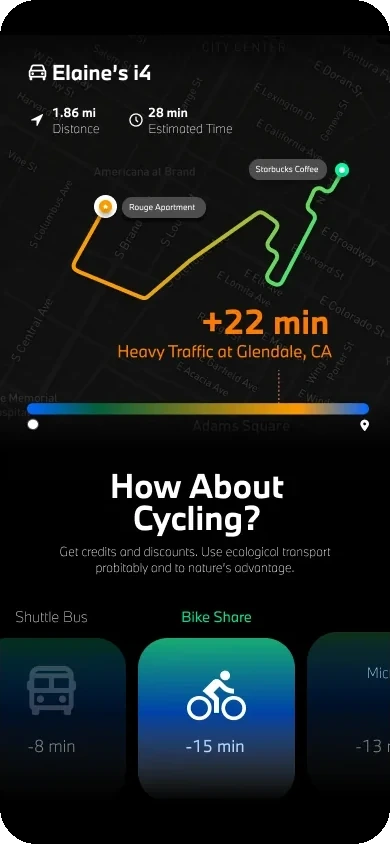
A route drawn as a traffic gradient, in light and dark map styles. Where it turns heavy, the map prices the delay (+22 min) and offers a bike share, shuttle or scooter in its place.
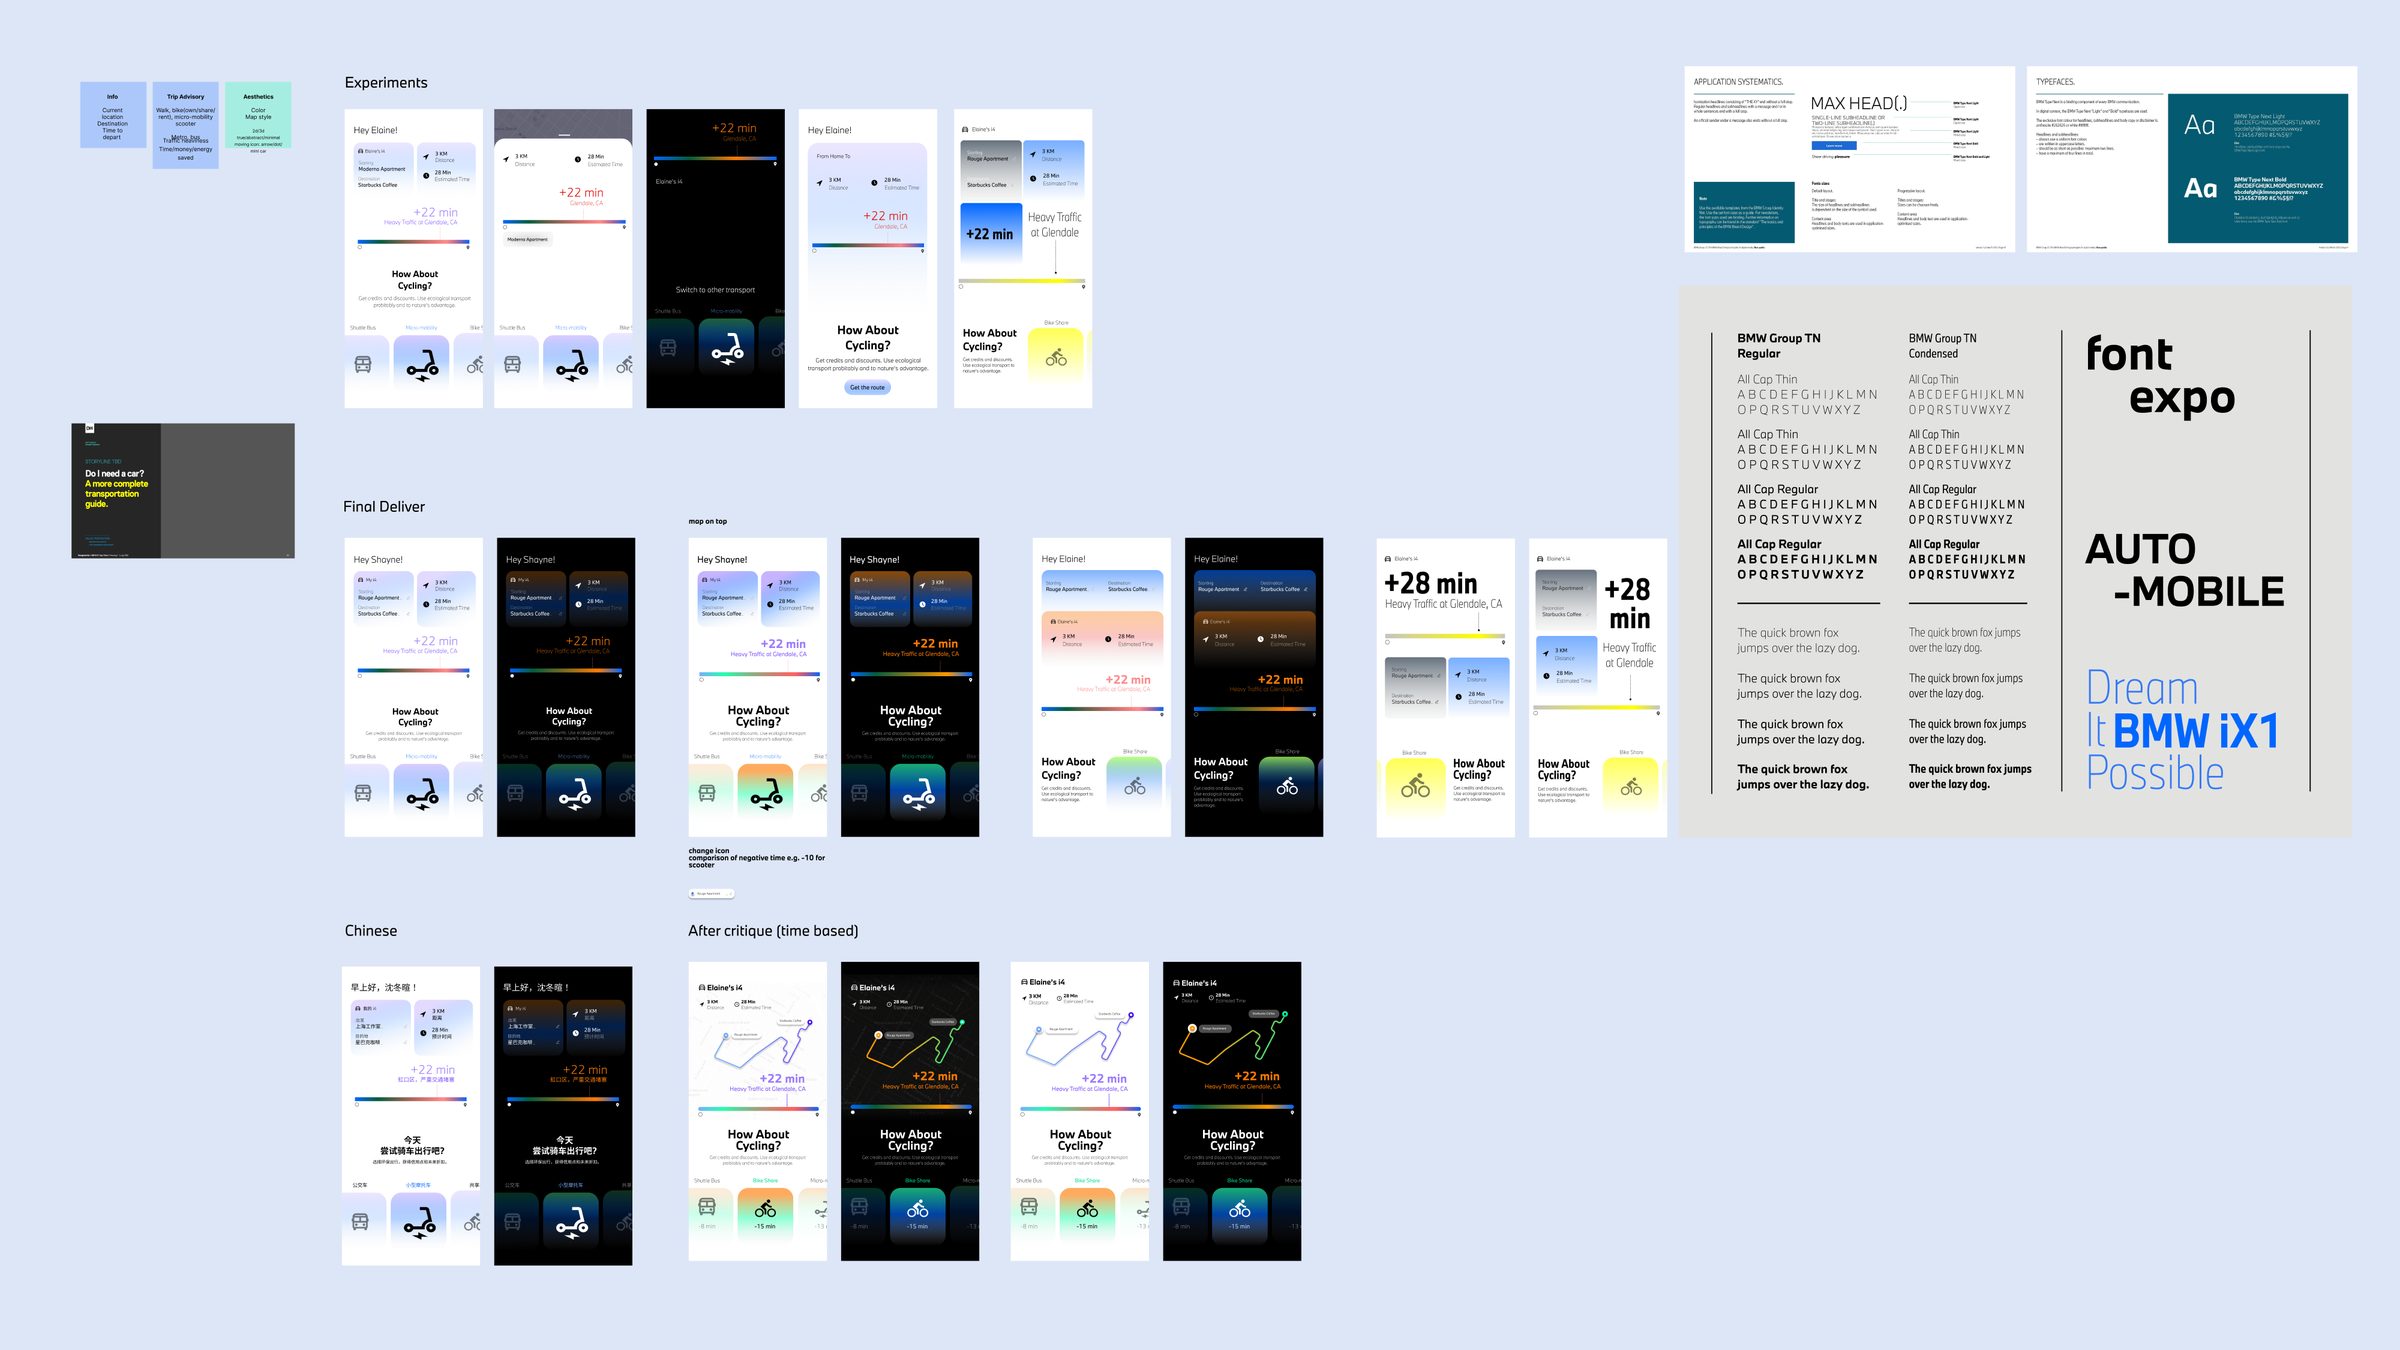
DESIGN DIRECTIONS
Several directions went to critique each week. This one moved from a card layout to a map-first, time-based route.
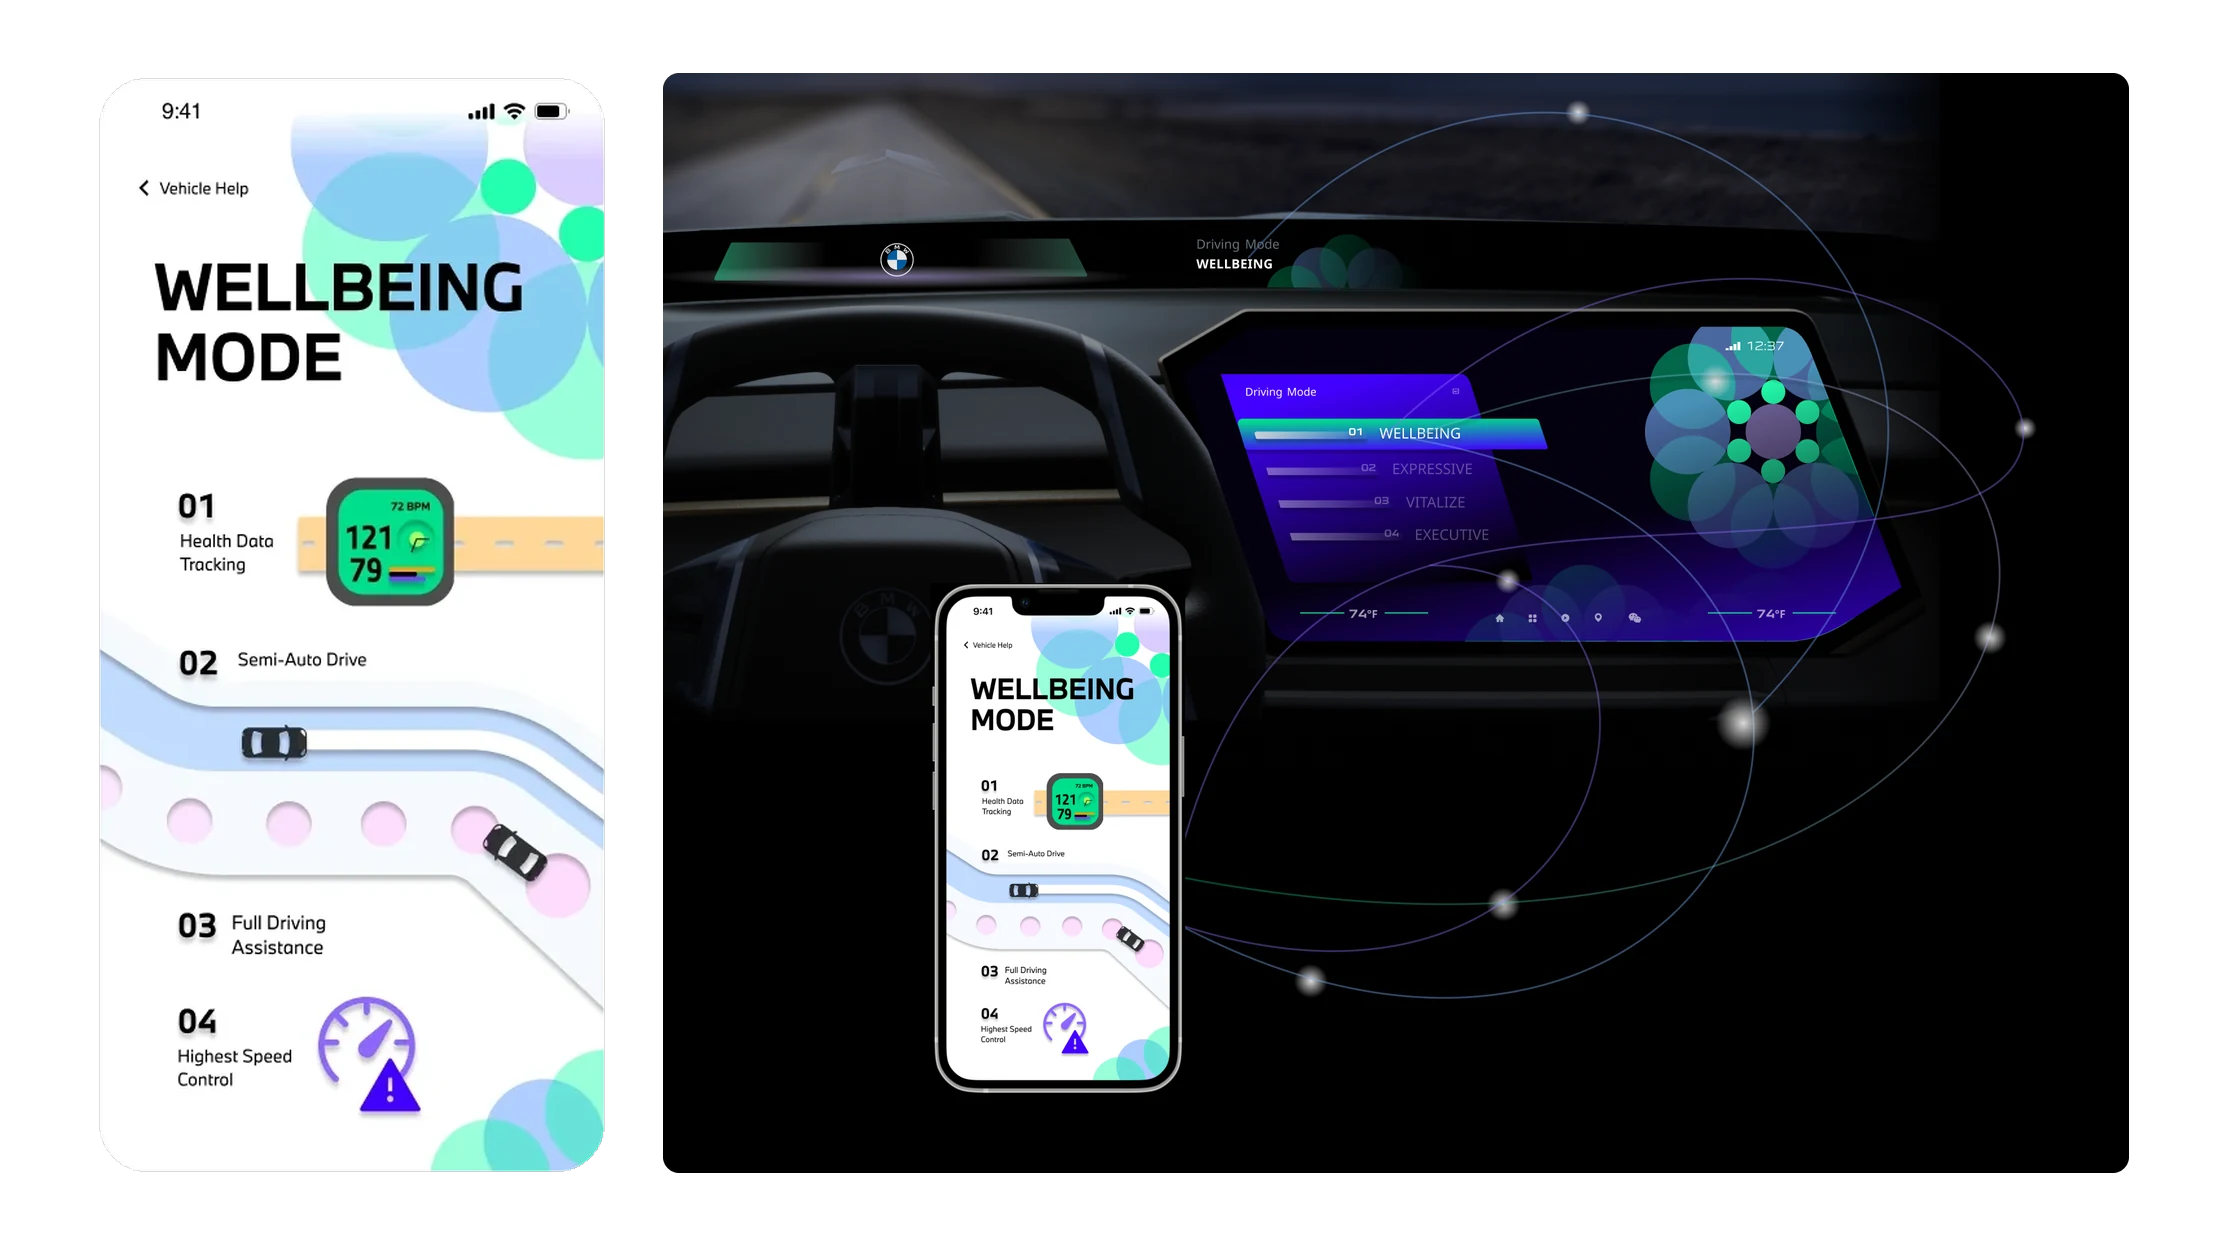
Road as interface
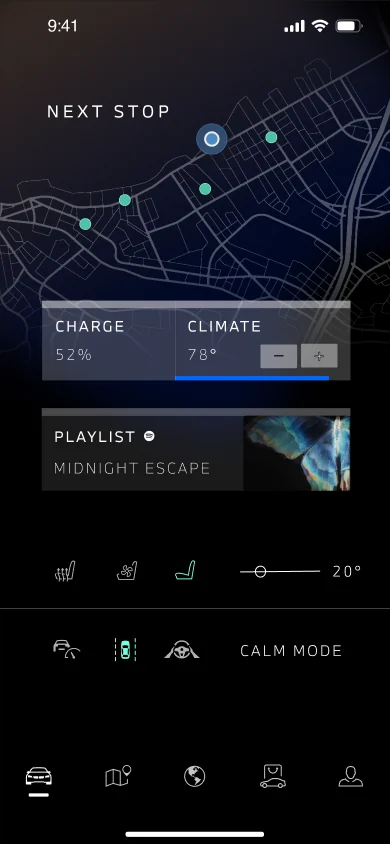
Wellbeing mode explains driver assistance along a stylized road, and the car display follows the mode picked on the phone.
Proximity-aware app
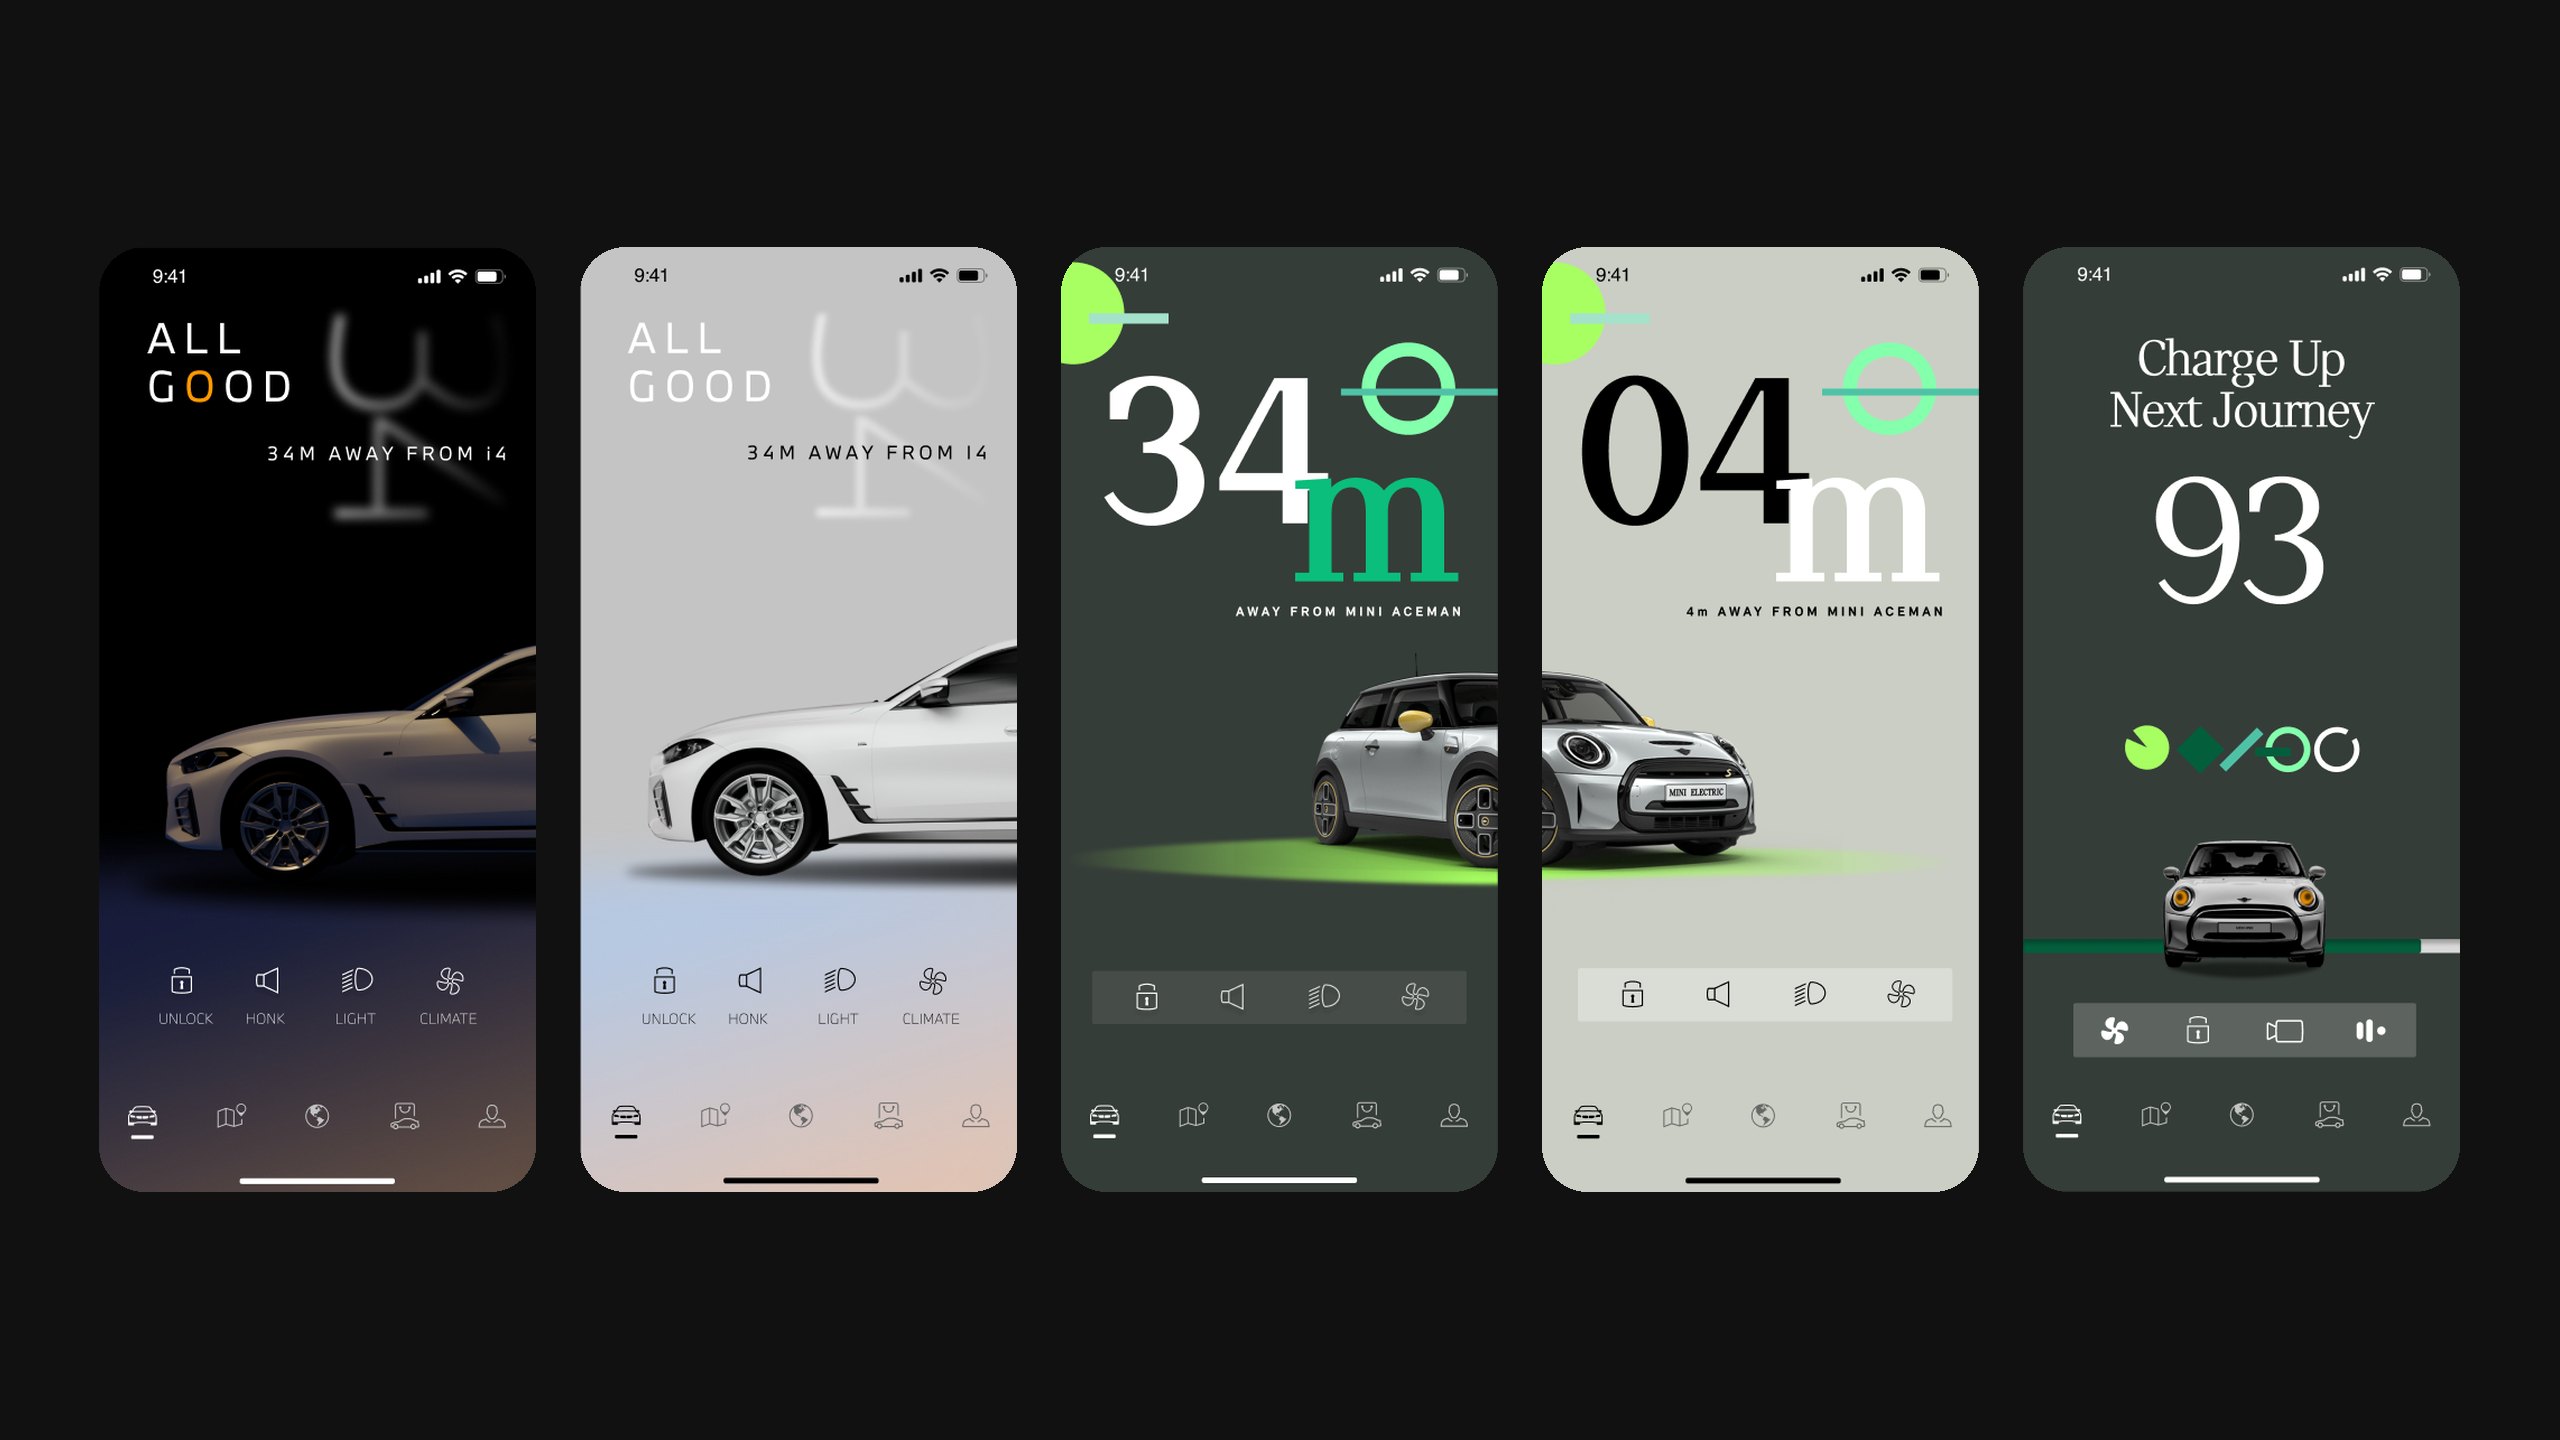
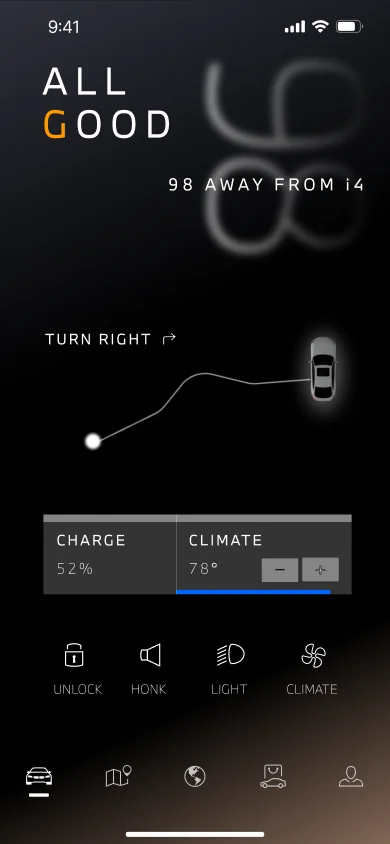
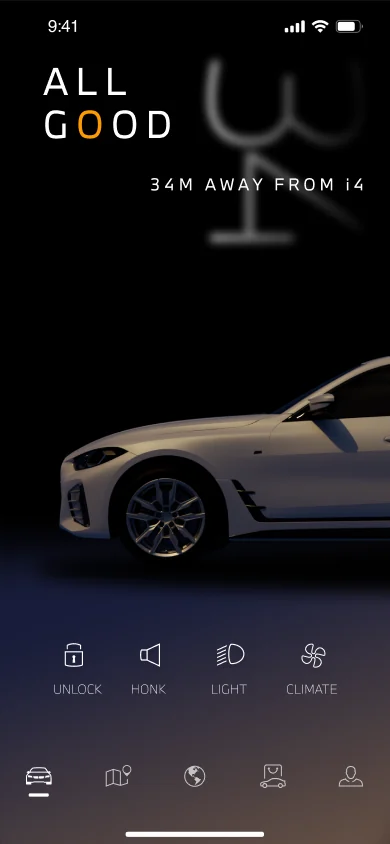
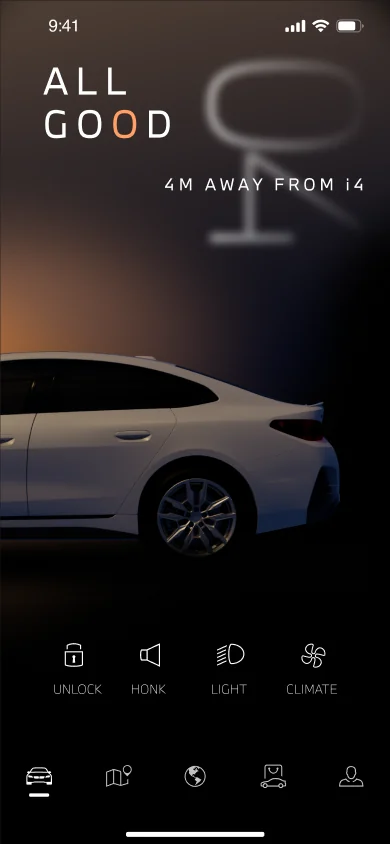
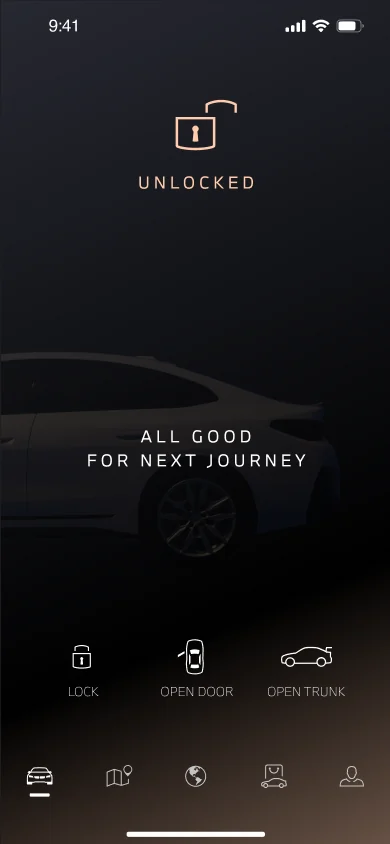
MyBMW changes state with your distance to the car. The closer you get, the less car on screen.
OVER 50 M
Vehicle finder, status and charge
UNDER 50 M
You’re close: honk or flash the lights to find it
NEXT TO THE CAR
Ready to unlock and go, with one minimal graphic
INSIDE
Next stop, playlist, climate and drive mode
Across screens
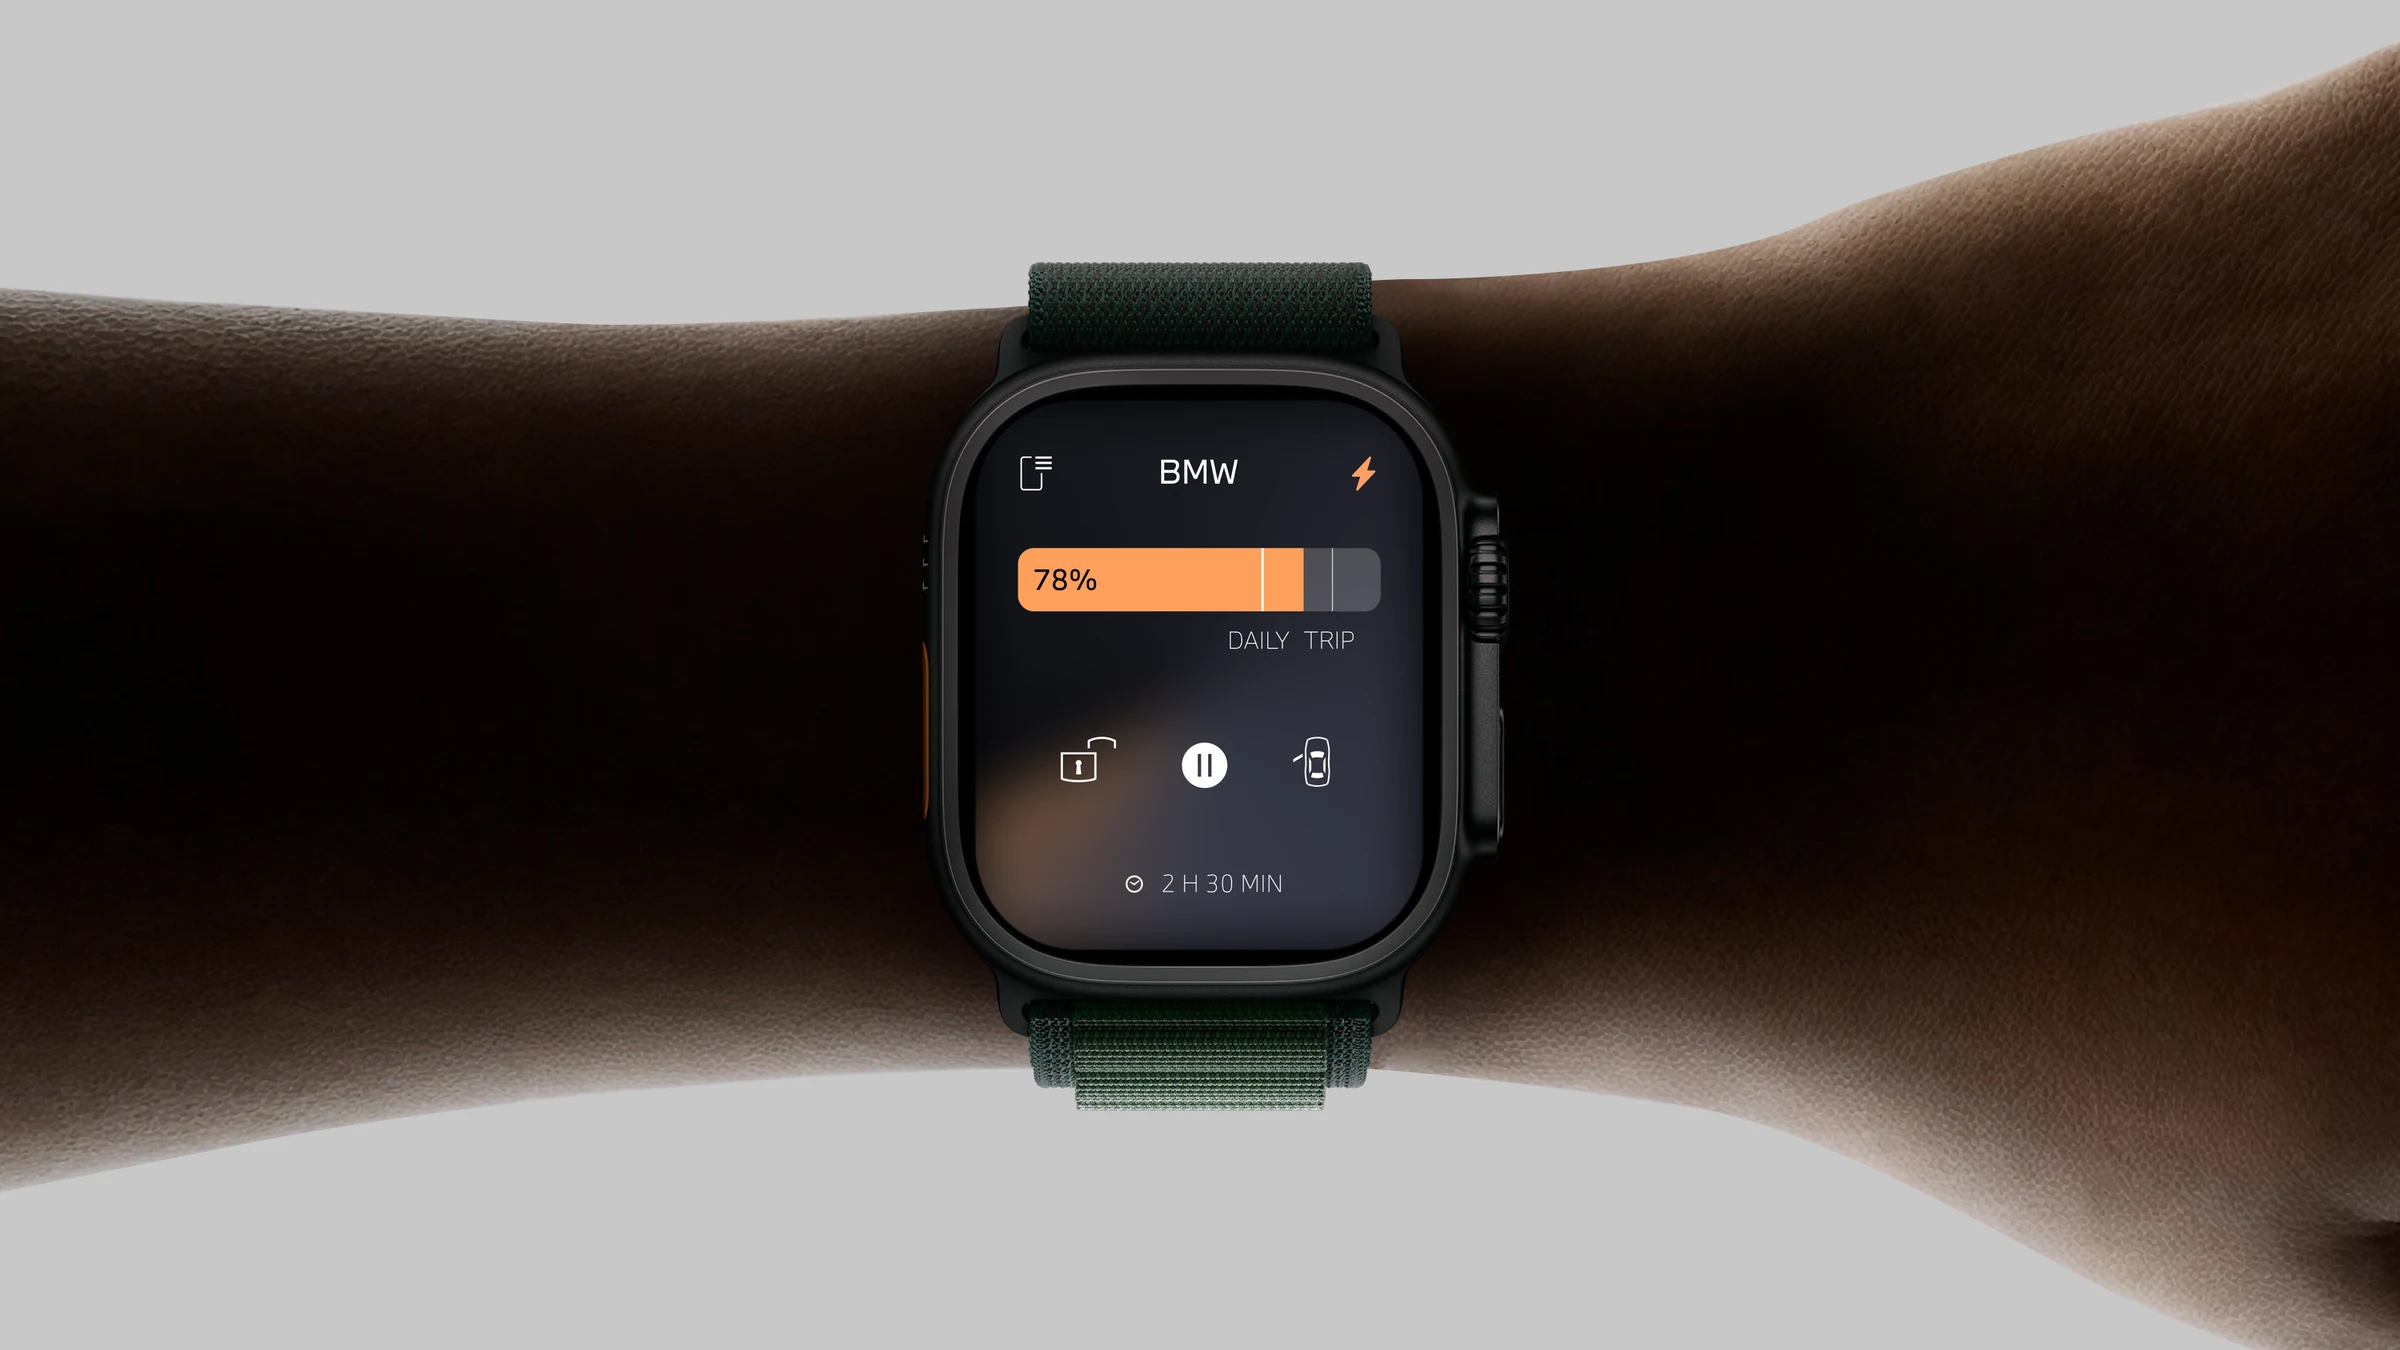
One visual system across three hardware platforms: phone, Apple Watch and the car display.